Info
- Status: Released
- Source: GitHub
- View: Website
- Technologies & Languages: Python, Sqlite3
- Machine Learning Models and Libraries: Qwen3-Embedding-4B, Huggingface Transformers
Related Posts and Projects
- Previous Project: Embedding-Based Steam Search
- Previous Project Dev Journal: Embedding-Based Steam Search
- Previous Project: Repo Search
Why?
I thought the previous project (text-based search engine with list of results) could be improved.
- It requires having a server online to process the freeform text input into an embedding. I wanted something I could share indefinitely as static files, offloading all of the logic to the client.
- The search engine only worked well when given an pre-existing game to find similar games to. So I wanted to limit the scope of the project to what I know works best.
- Discovering new games by continually clicking on “More like this” is tedious and prone to repetition.
- I wanted to update the embedding model used as
Instructoris now quite outdated.
The Creation Process
This is like a (not-so-)mini blog post about how I made this project, since I’m probably not going to do an actual blog post about it.
This’ll take you through the process I went through in order to make this map.
Refresh Steam Data
New games are added to Steam daily. The total number of games on Steam doubles yearly, according to the last two years I’ve refreshed the game list. So the first order of business was to fetch updates from Steam.
- Related Dev Journal: Embedding-Based Steam Search - Part 1 - Obtaining Data
Some things have changed since I have written that page. Steam now requires an api key to access the list of games, and also the list of games is now paginated. A welcome change when the complete list now contains over 200,000 games.

Another thing I wanted to show was the review summary for games on Steam as well, as there’s a large number of games out there with bad and/or no reviews at all. While I had a lot of review text, the overall summary / sentiment score wasn’t something I had, nor did I want to independently recreate it.
There was also quite a number of hidden issues with the way the reviews were being fetched for the previous embedding-based steam search that got ironed out over the couple of weeks I spent fetching data.

And finally, I wanted a way to show the list of community-assigned tags associated with a game on Steam. That was a larger problem, as it turns out Steam Game Tags are not listed anywhere in the Steam Store API. The solution to this required using a library: GitHub - ValvePython/steam, which mimics a real Steam client to issue requests to Valve’s servers. Apparently this is the only way to know the community-assigned tags for a game on Steam.
(Obviously there must be a way to do it via HTTP requests, the Steam Store does it. But when I tried to look into it more, but couldn’t find any concrete information. So in the end, I went with the steam library.)
Even this library had multiple issues with long-running fetches of game tags. There were a few times where it would just completely stop receiving data and I had to force quit and restart the script in order to fix it.
Update the Embedding Process
As I spent weeks refreshing (and re-refreshing as I decided I wanted more and more data), I also spent some time refining the way games and reviews were embedded.
In the original search-engine with Instructor, the context was very limited. As a result, the only thing that got embedded was solely the store description / review text itself and nothing else. I believe that this lack of context caused many unrelated games to be considered similar by the embeddings.
To improve this, I changed models to qwen3-embedding. These models support context sizes of up to 32k tokens.
It’s nice to have the theoretical room, however it’s mostly unusable for someone like me who is equipped with a single RTX 3090 (24 GB of VRAM) and an M2 Mac (64 GB of RAM). So my context size only expanded from ~512 tokens to 4096/8192 tokens.
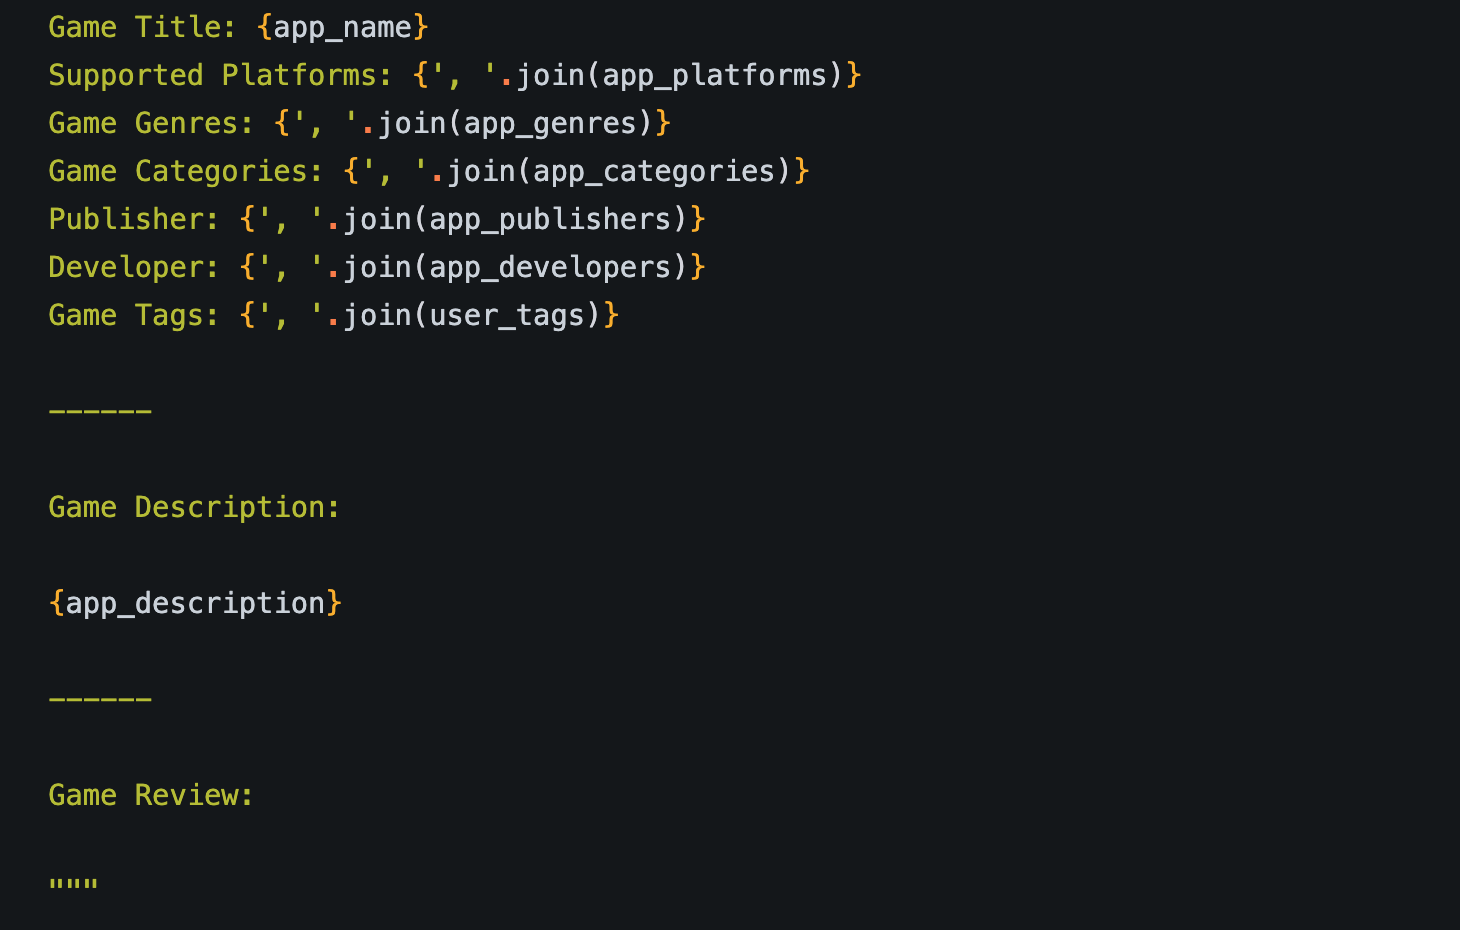
What the model “saw” when embedding a review for a game.
4k tokens is more than enough to provide the models with additional context, though. So when embedding store descriptions and reviews, the models were also given additional information this time around.
Additionally, when embedding a review, the model was also shown the game’s short store description to help provide additional grounding context when the review is just a single sentence long.
All this combined to helpfully make a more ‘meaningful’ embedding which I can then use to make a map.
I also played around with how I ‘merged’ reviews for a given game. Originally, because of the small context, reviews were embedded individually. Then those embeddings were later combined using math (mean pooling, basically averaging them).
I wanted to experiment with showing the model multiple reviews at once, and building an embedding from that. This worked, however it also had the unintended side-effect of clustering games based on how many reviews existed in a single embedding.
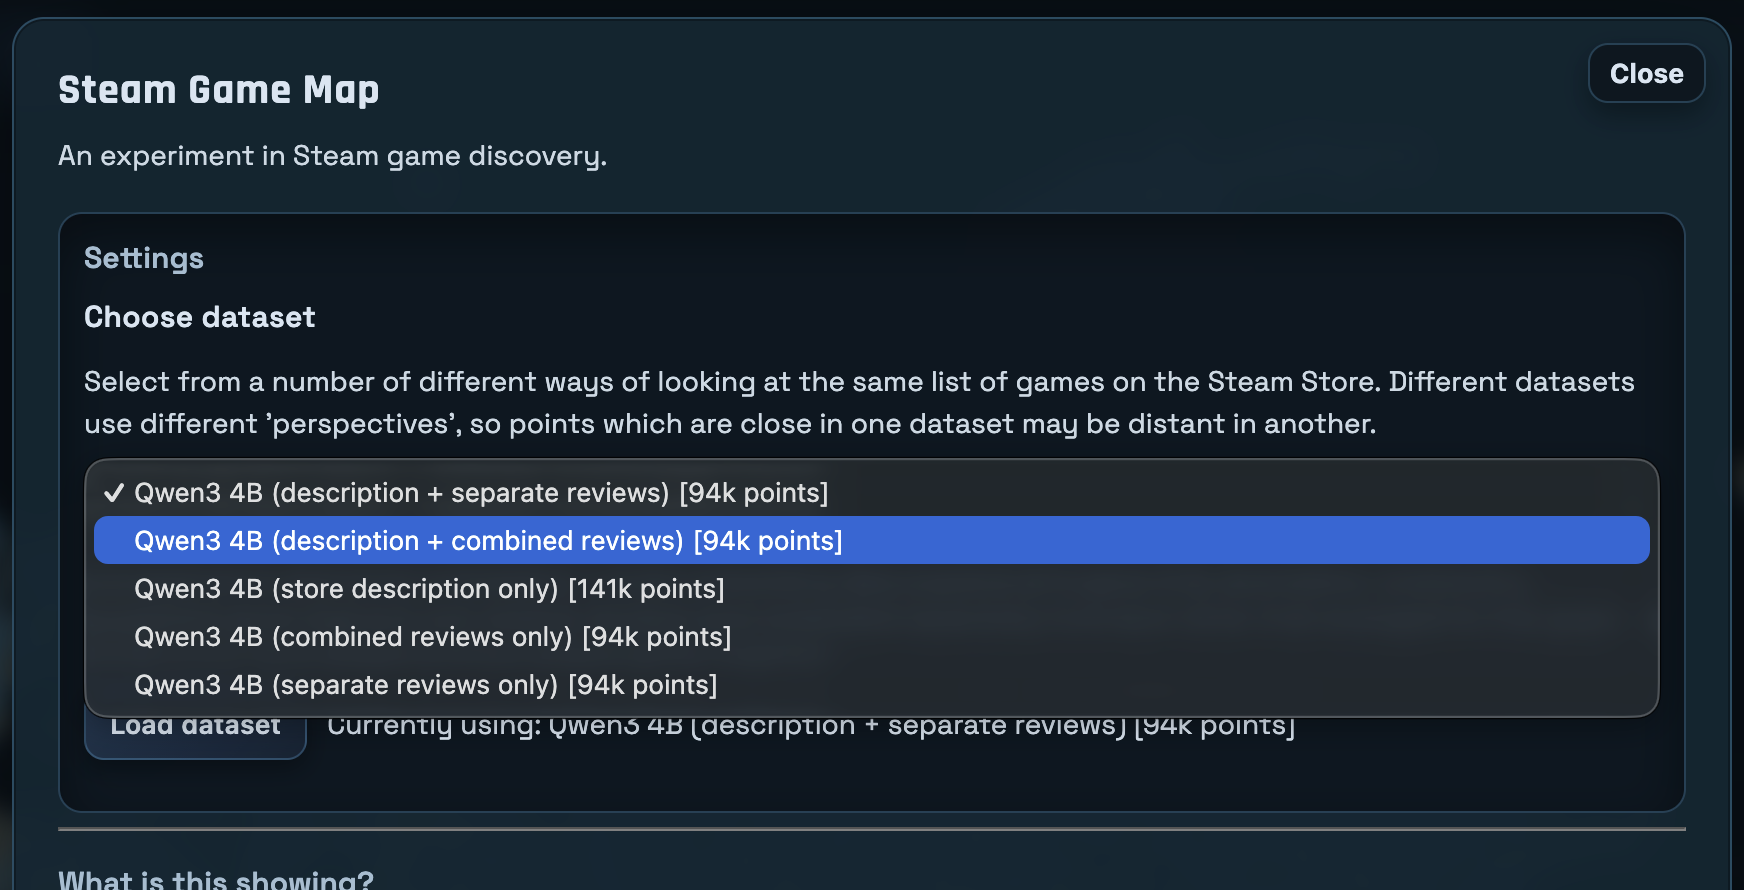
The “combined” option is where all reviews were combined into a single document.
In the end, I wound up making this method of embedding an option instead of the default view (which means basically nobody is ever going to see it).
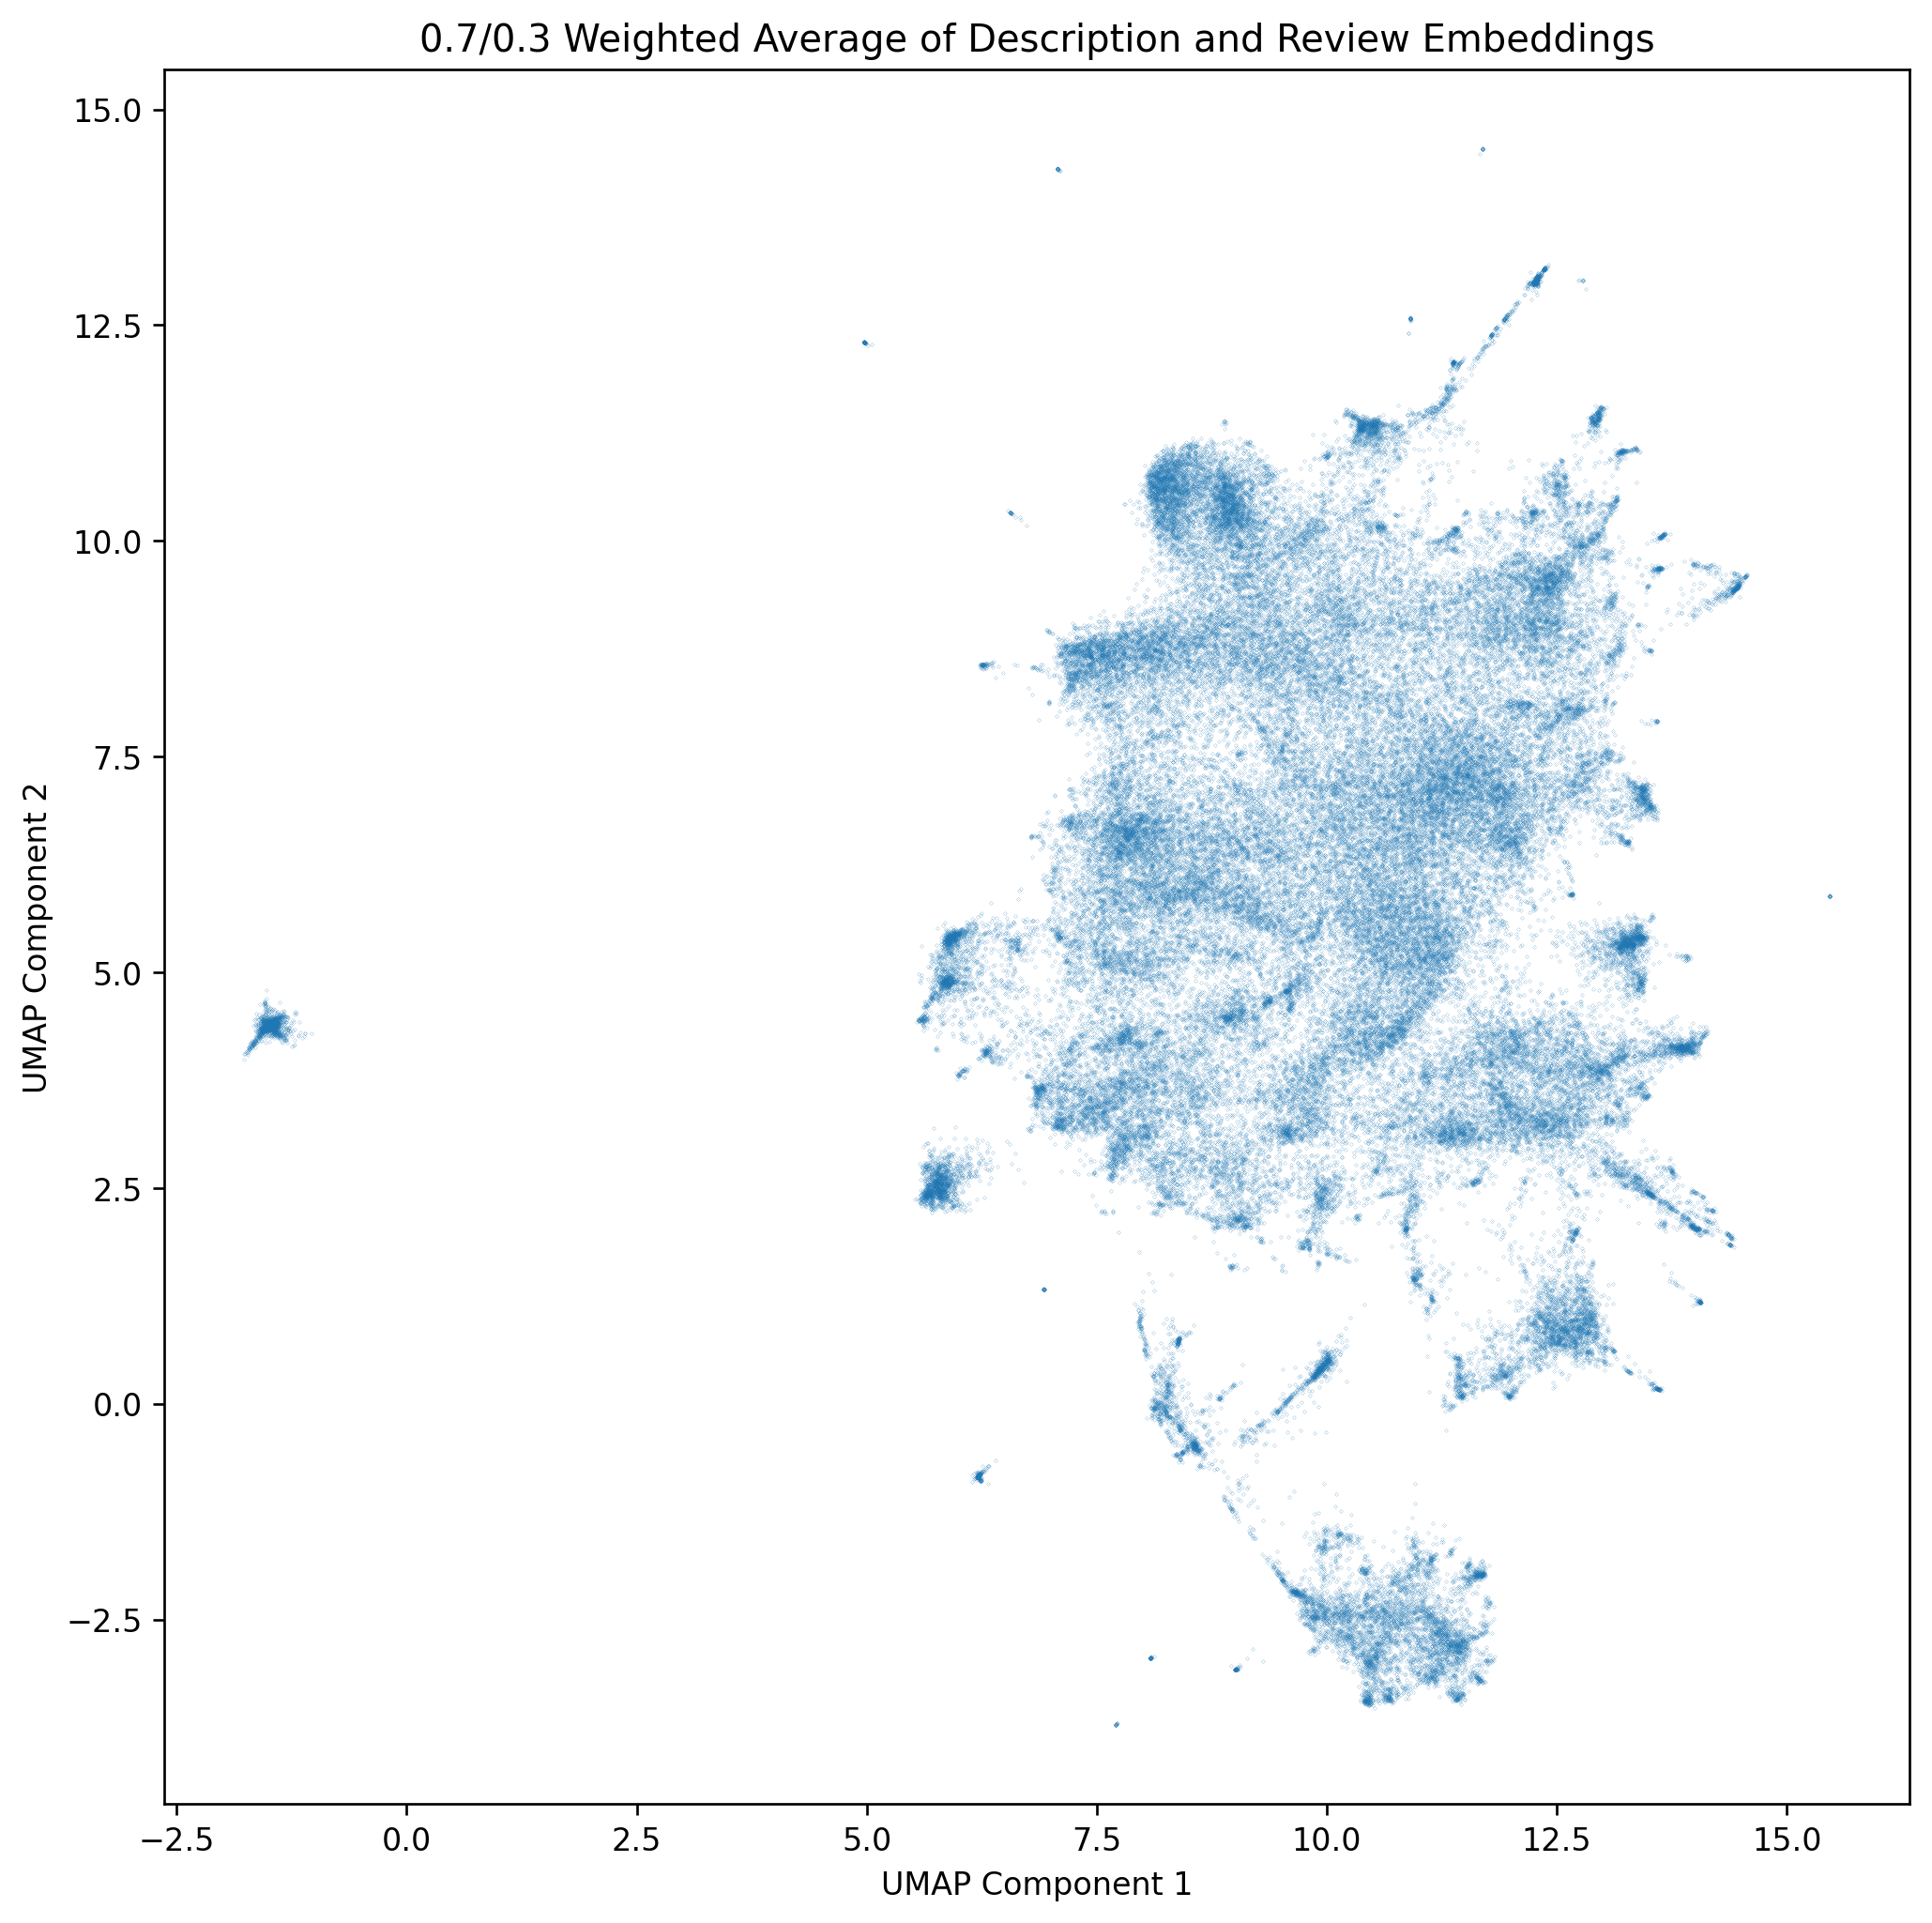
Dimension Reduction to 2D
The next step is to take the embeddings the model gives us and somehow plot them on a 2D map. I’ve dabbled with making maps of embeddings previously, so this was a step I was already familiar with.
Once you have a dataset of embeddings, you can ‘flatten’ them using a few different techniques. The one I’ve pretty much ‘settled’ on (read: given up trying to improve upon) is:
- Starting with PCA to reduce the embedding from whatever number of dimensions the embedding model outputs down to 50 dimensions.
- Finishing with UMAP to reduce from 50 dimensions down to 2 for the final point positions.
This was mostly arrived at by asking LLM’s how to do this kind of thing, and this was what they offered. I’m sure there’s better ways of doing it, and I’m sure the parameters I picked for these two algorithms could also be improved upon as well.
After these two algorithms finish, we have a list of games and their positions on the map.
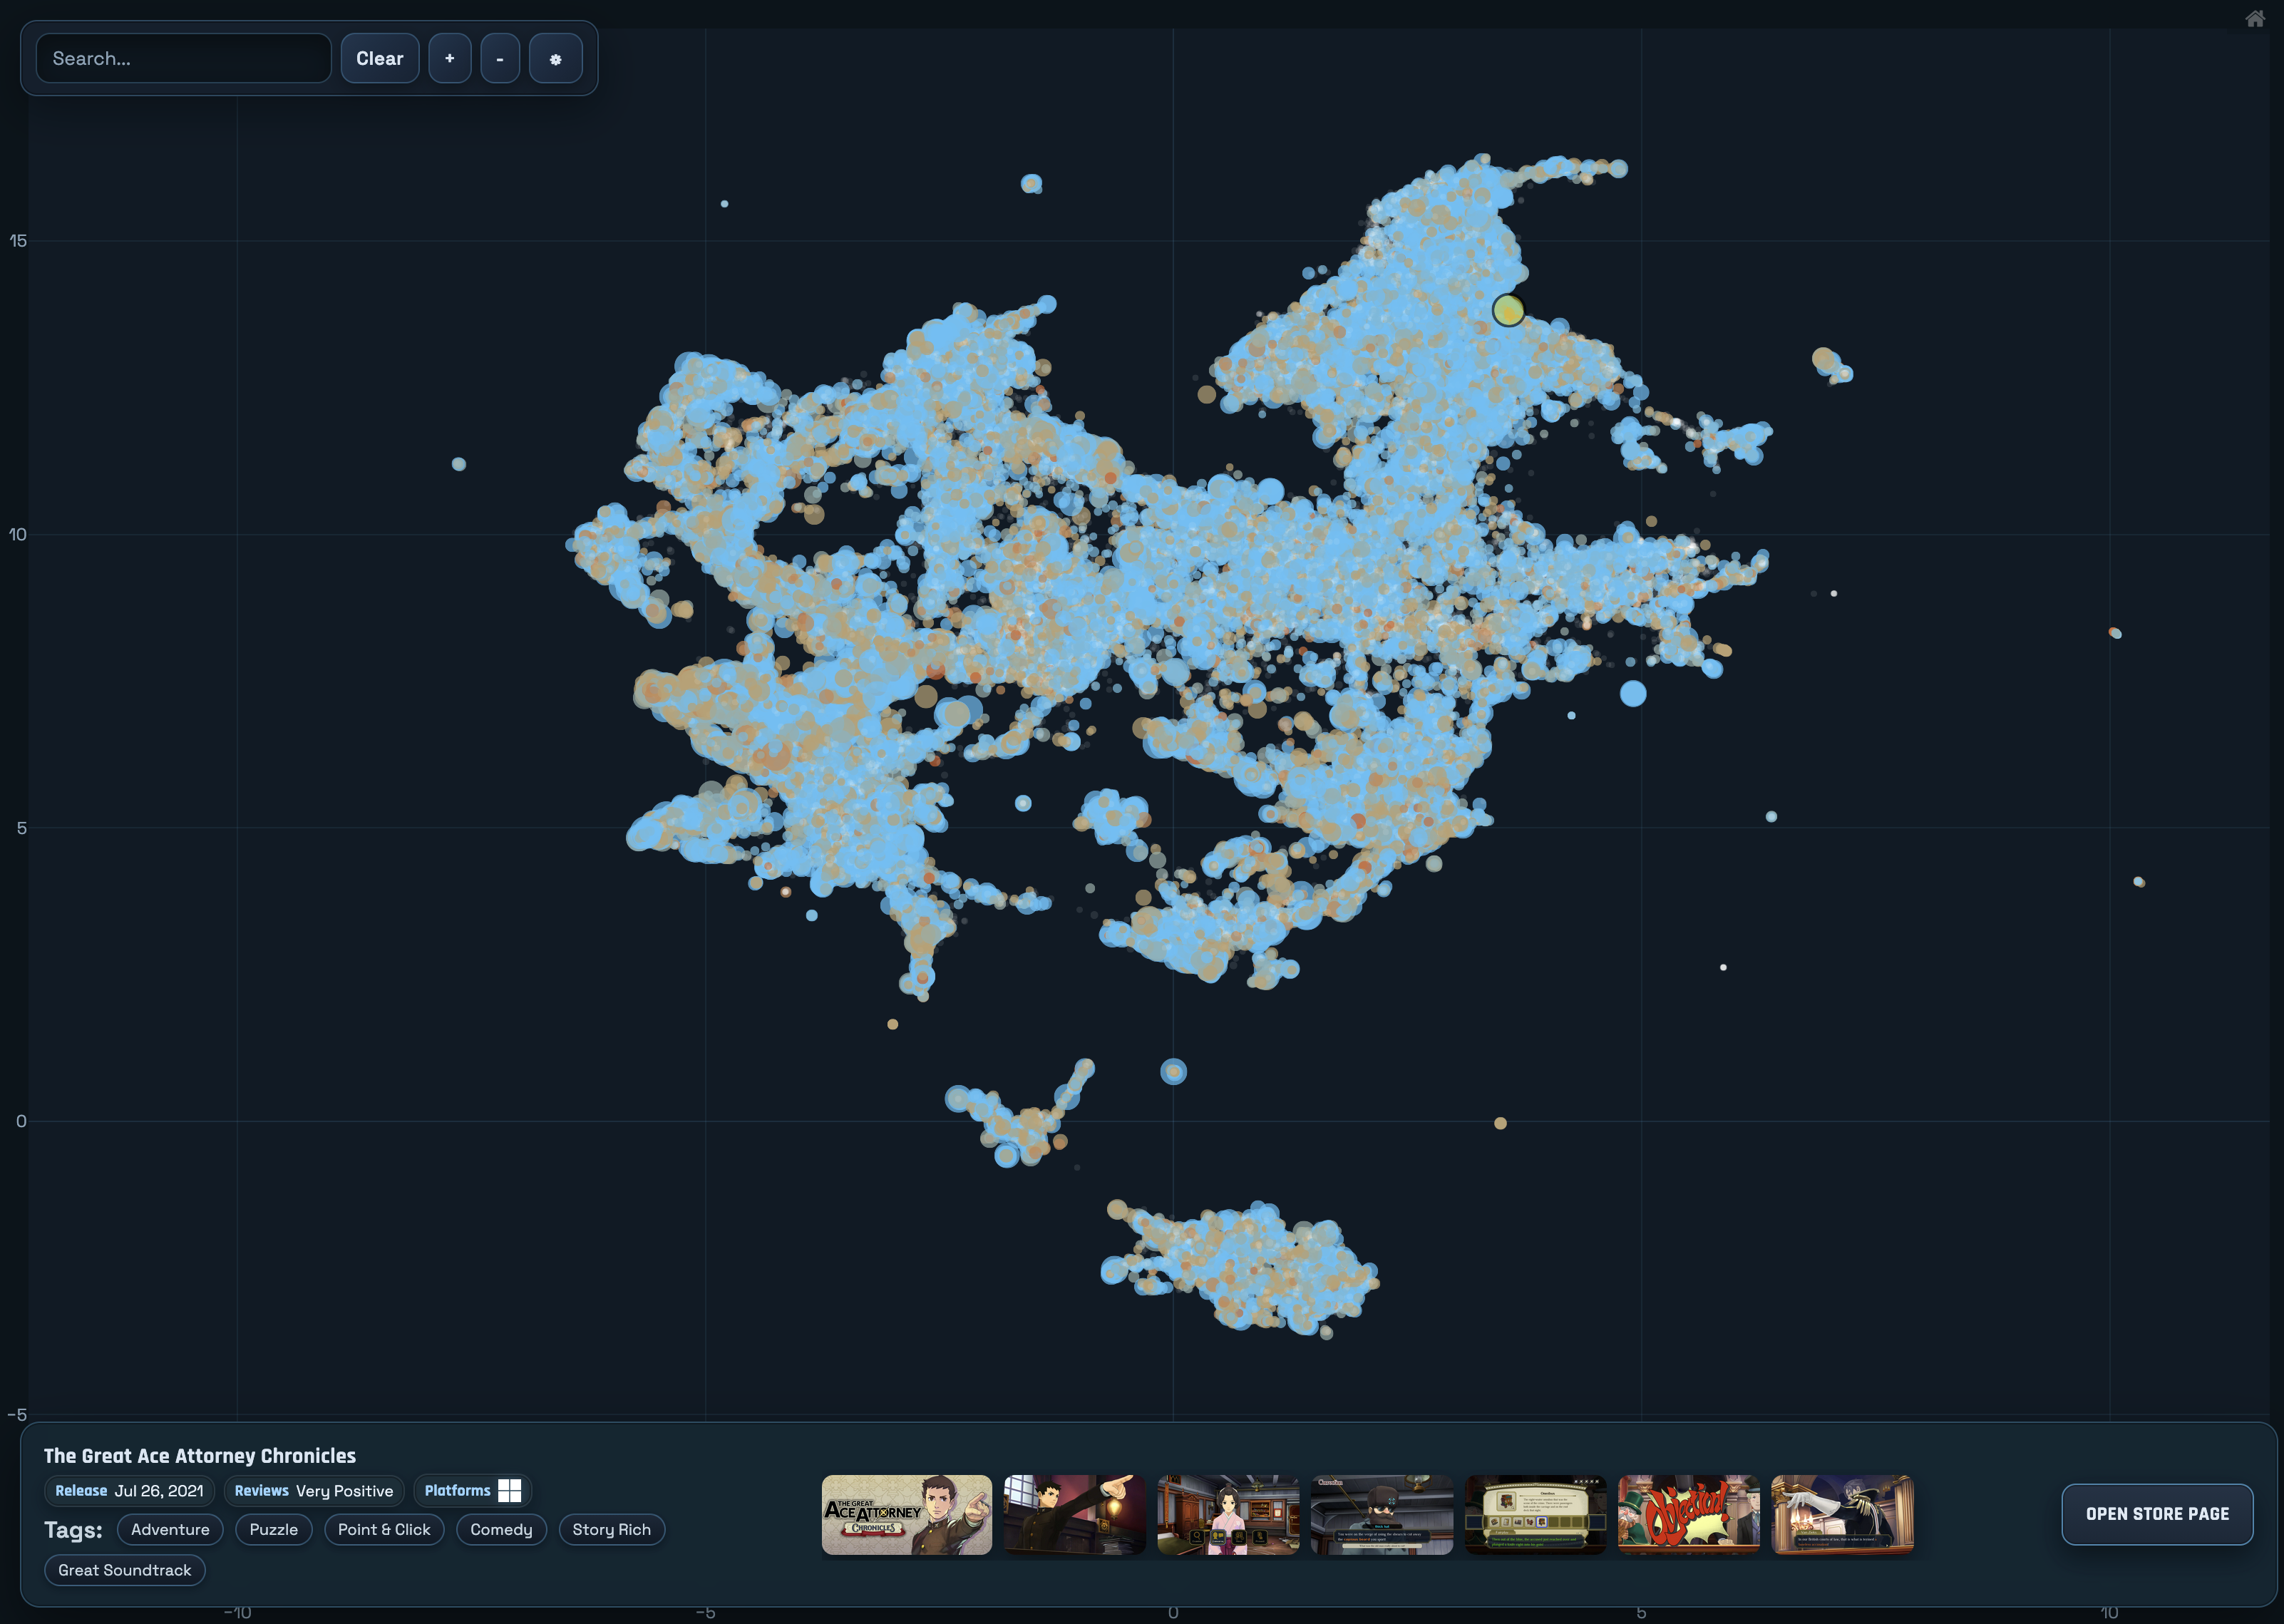
Making the Map into a Website
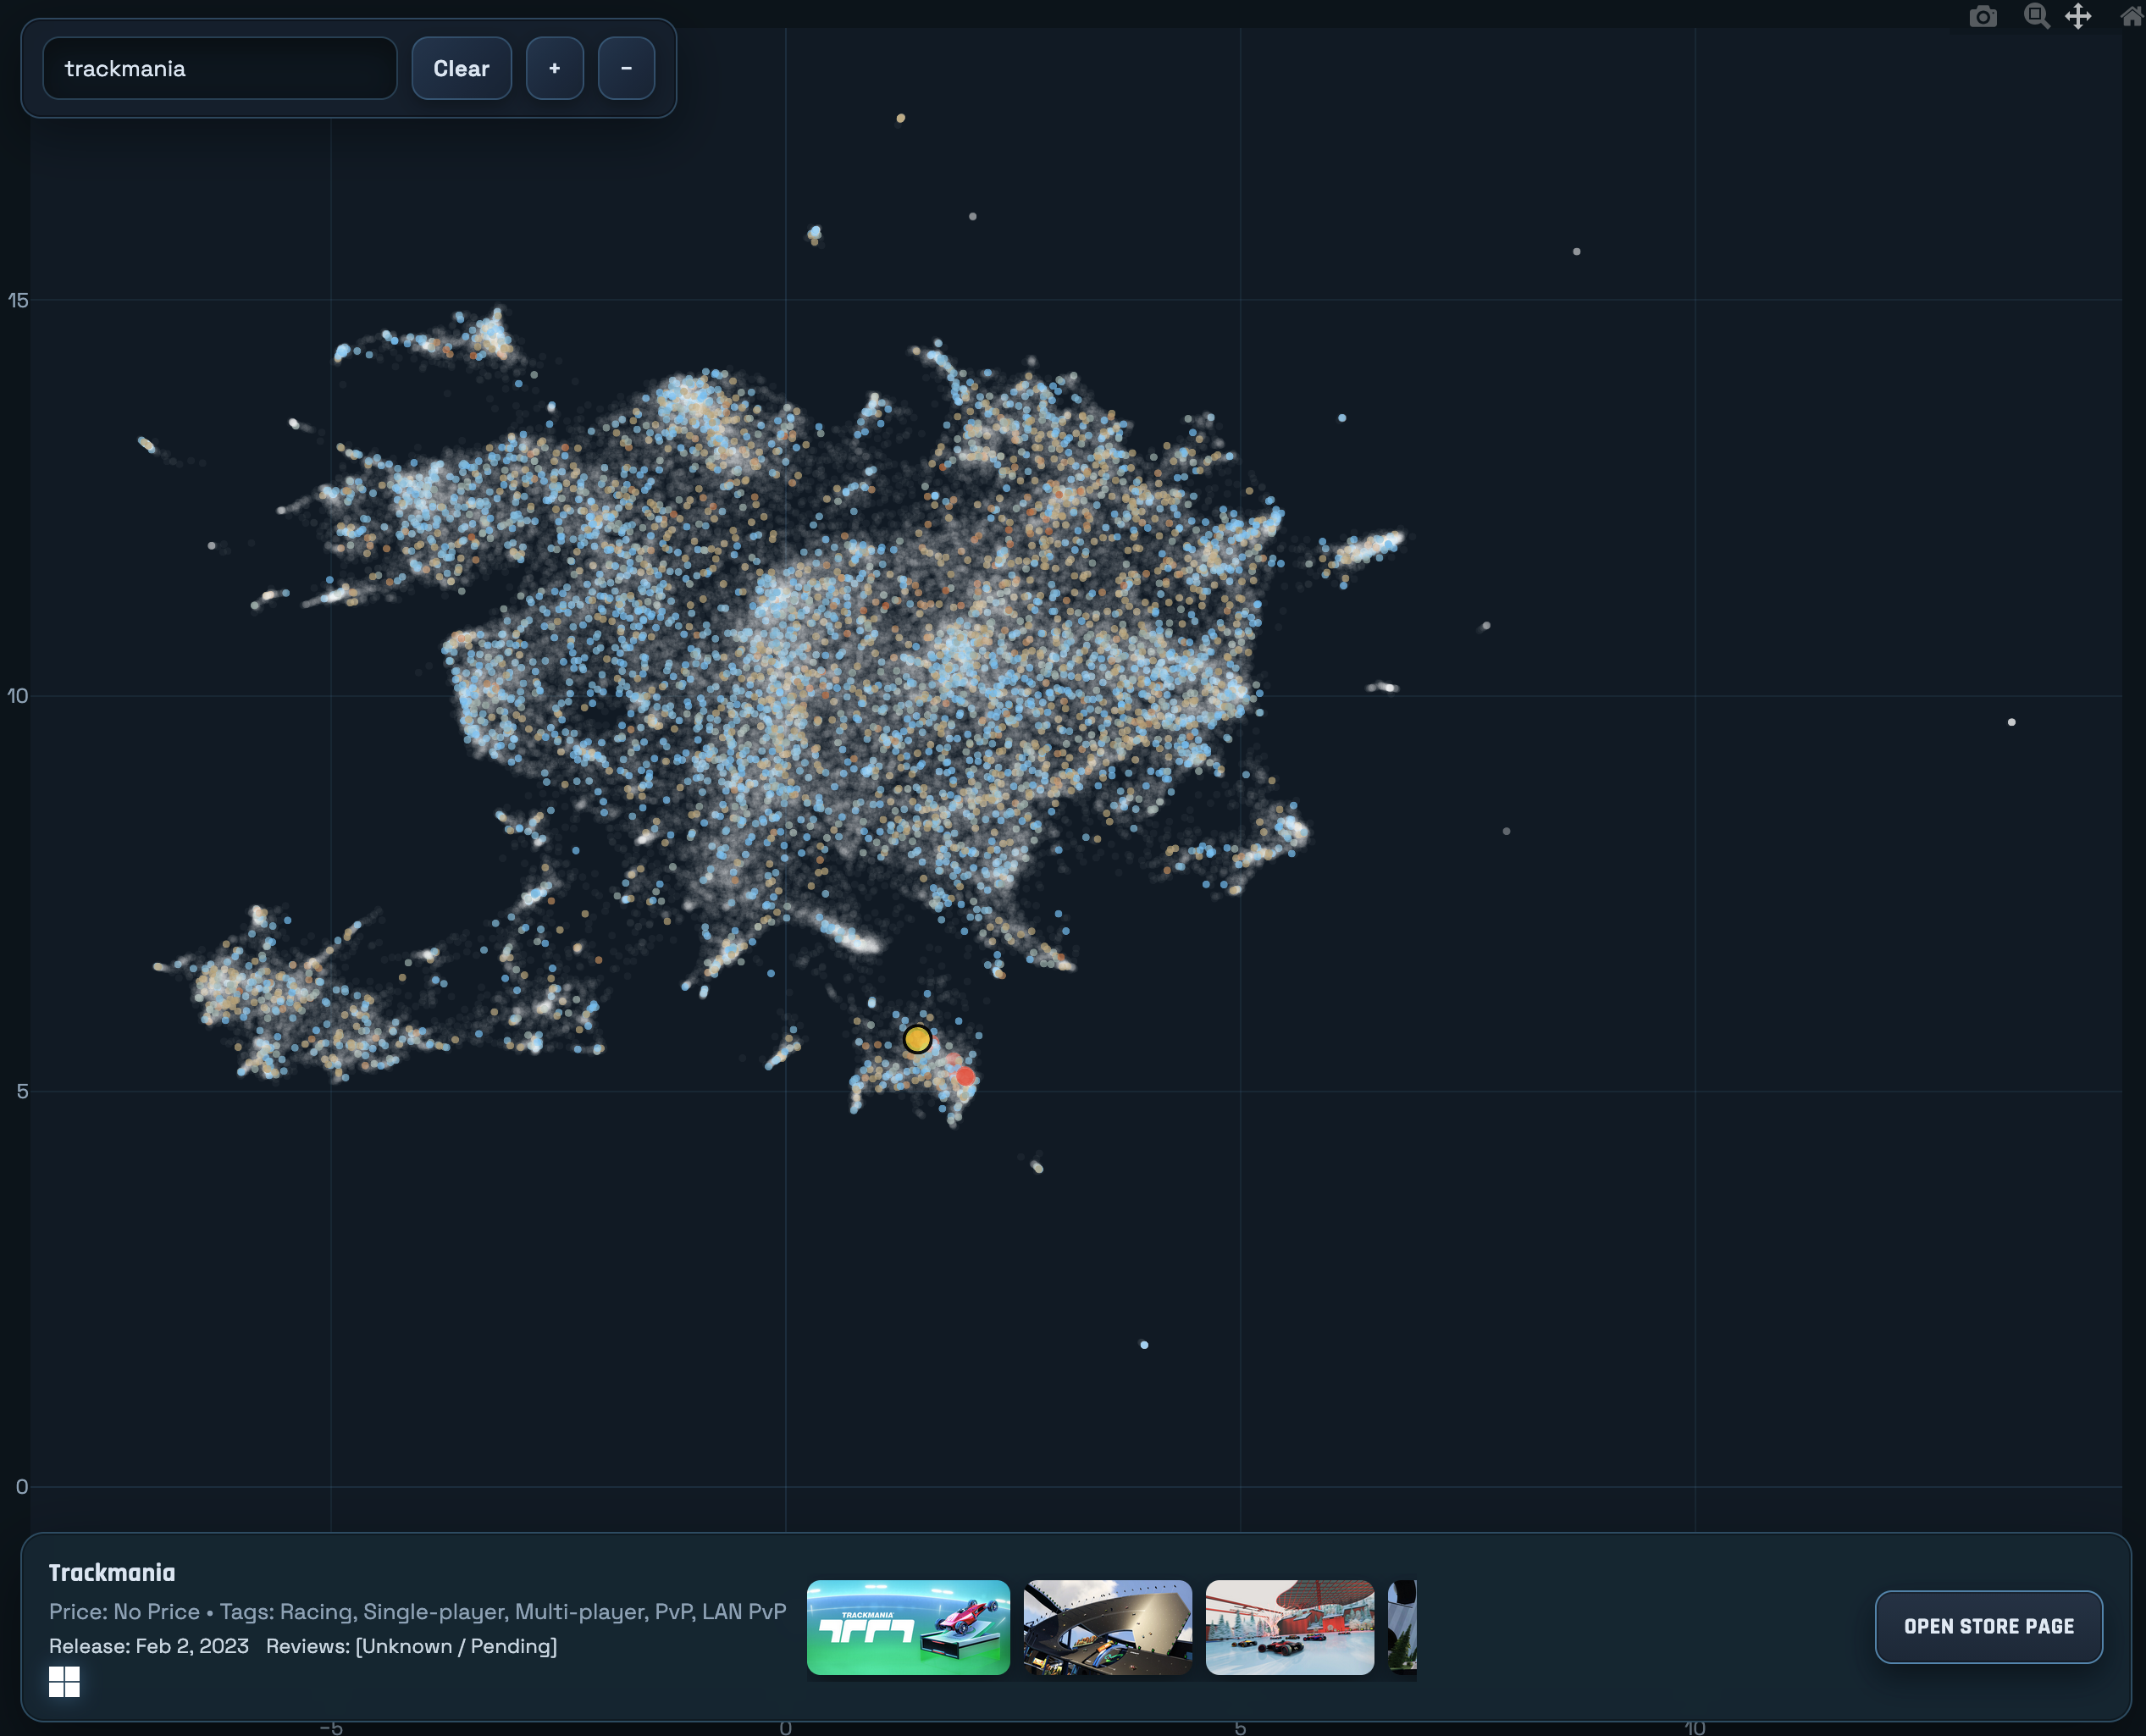
The final step is to plot these points visually on a map so that people can look at them. The image above is nice and all, but wouldn’t it be nice if you could know what game is behind each point on that map?
Since this project was intended to be served as static files, and I didn’t want to implement my own map interactivity, I looked to JavaScript plotting libraries which offered interactivity. I evaluated a few, and ultimately settled on Plotly.
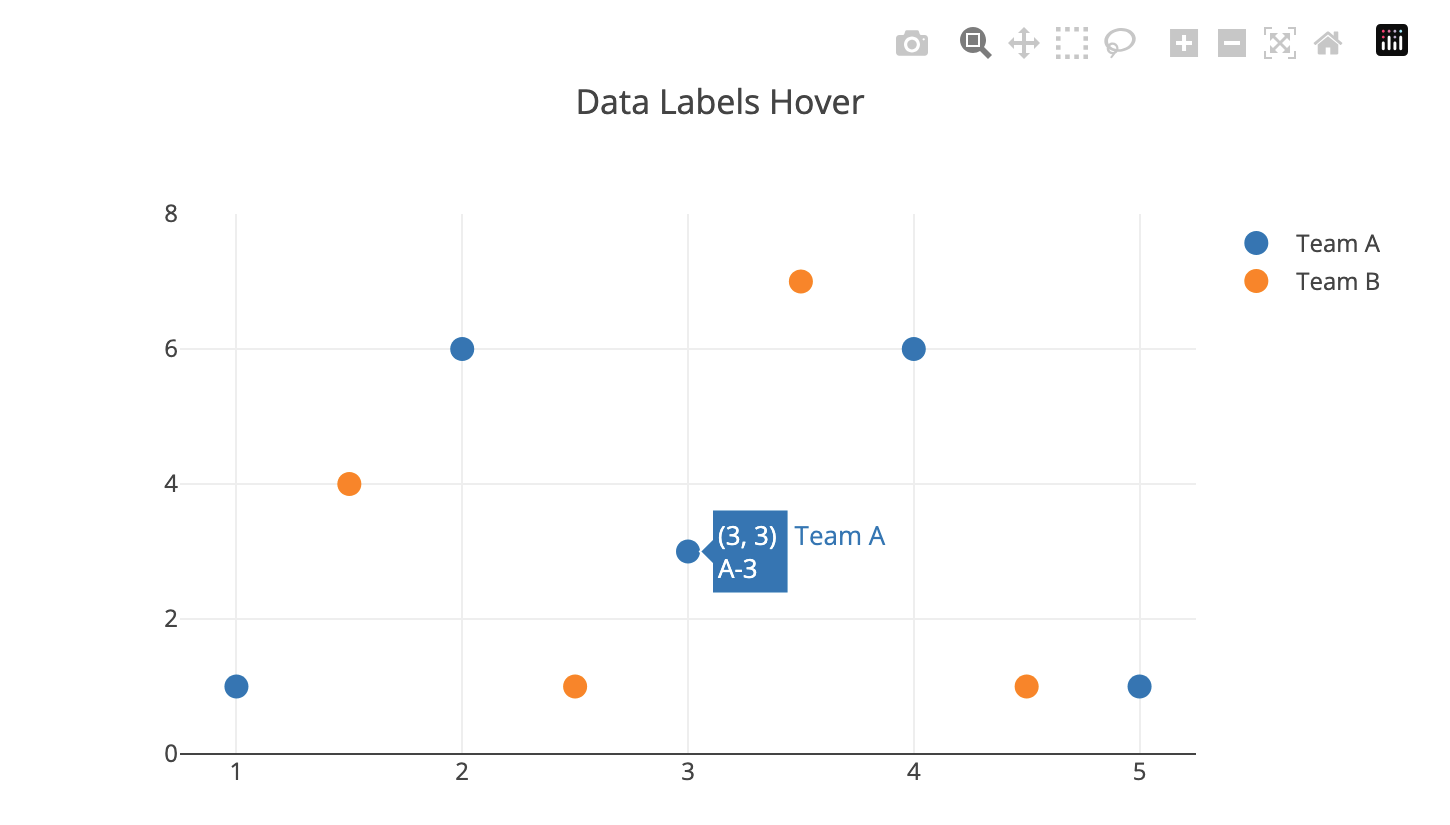
Plotly was the library that had the most ‘out of the box’ features which meshed with how I wanted the ‘Map’ (scatterplot) to behave.
It had support for tooltip hover-over for the points, extensive customization for how the points are displayed, built-in zoom windowing, and had options to hide all the built-in tools so that you can re-implement your own input methods.
However, Plotly did lack one critical feature which required me to implement my own solution: mobile touch inputs. Perhaps I missed some documentation, but out of the box Plotly does not handle multiple touch inputs properly. Each finger that interacts with the map acts as a separate ‘drag’ event (or whichever tool you currently have selected). The final version of the map uses a vibe-coded implementation of multi-input zooming that took a few iterations to get right. Codex is pretty good at most things, however the specific details of libraries is one place where it often hallucinates things. It was able to get 98% of the way to a working multi-input zoom gesture. The only problem it had was disabling Plotly’s built-in input event handling, preferring to add JS hack upon hack to try anything to get Plotly to stop handling input events. The solution was to bypass input handling entirely. Once the user begins a multi-input gesture, we set Missing Feature: Multi-Input Gesture Handling
xaxis.fixedrange and yaxis.fixedrange to true for the plot, which prevents Plotly’s built-in tools from modifying the viewing window. Our input handlers then directly modify the plot’s view on input events. Finally, we restore fixedrange to false once the multi-input gesture ends, so that Plotly’s tools once again work.
With the presentation layer decided, the next decision was how to structure the data.
Or, rather, that decision was made for me, as it was immediately obvious I couldn’t share around a multi-hundred MB javascript file containing data on every Steam game to every person who visited my site.
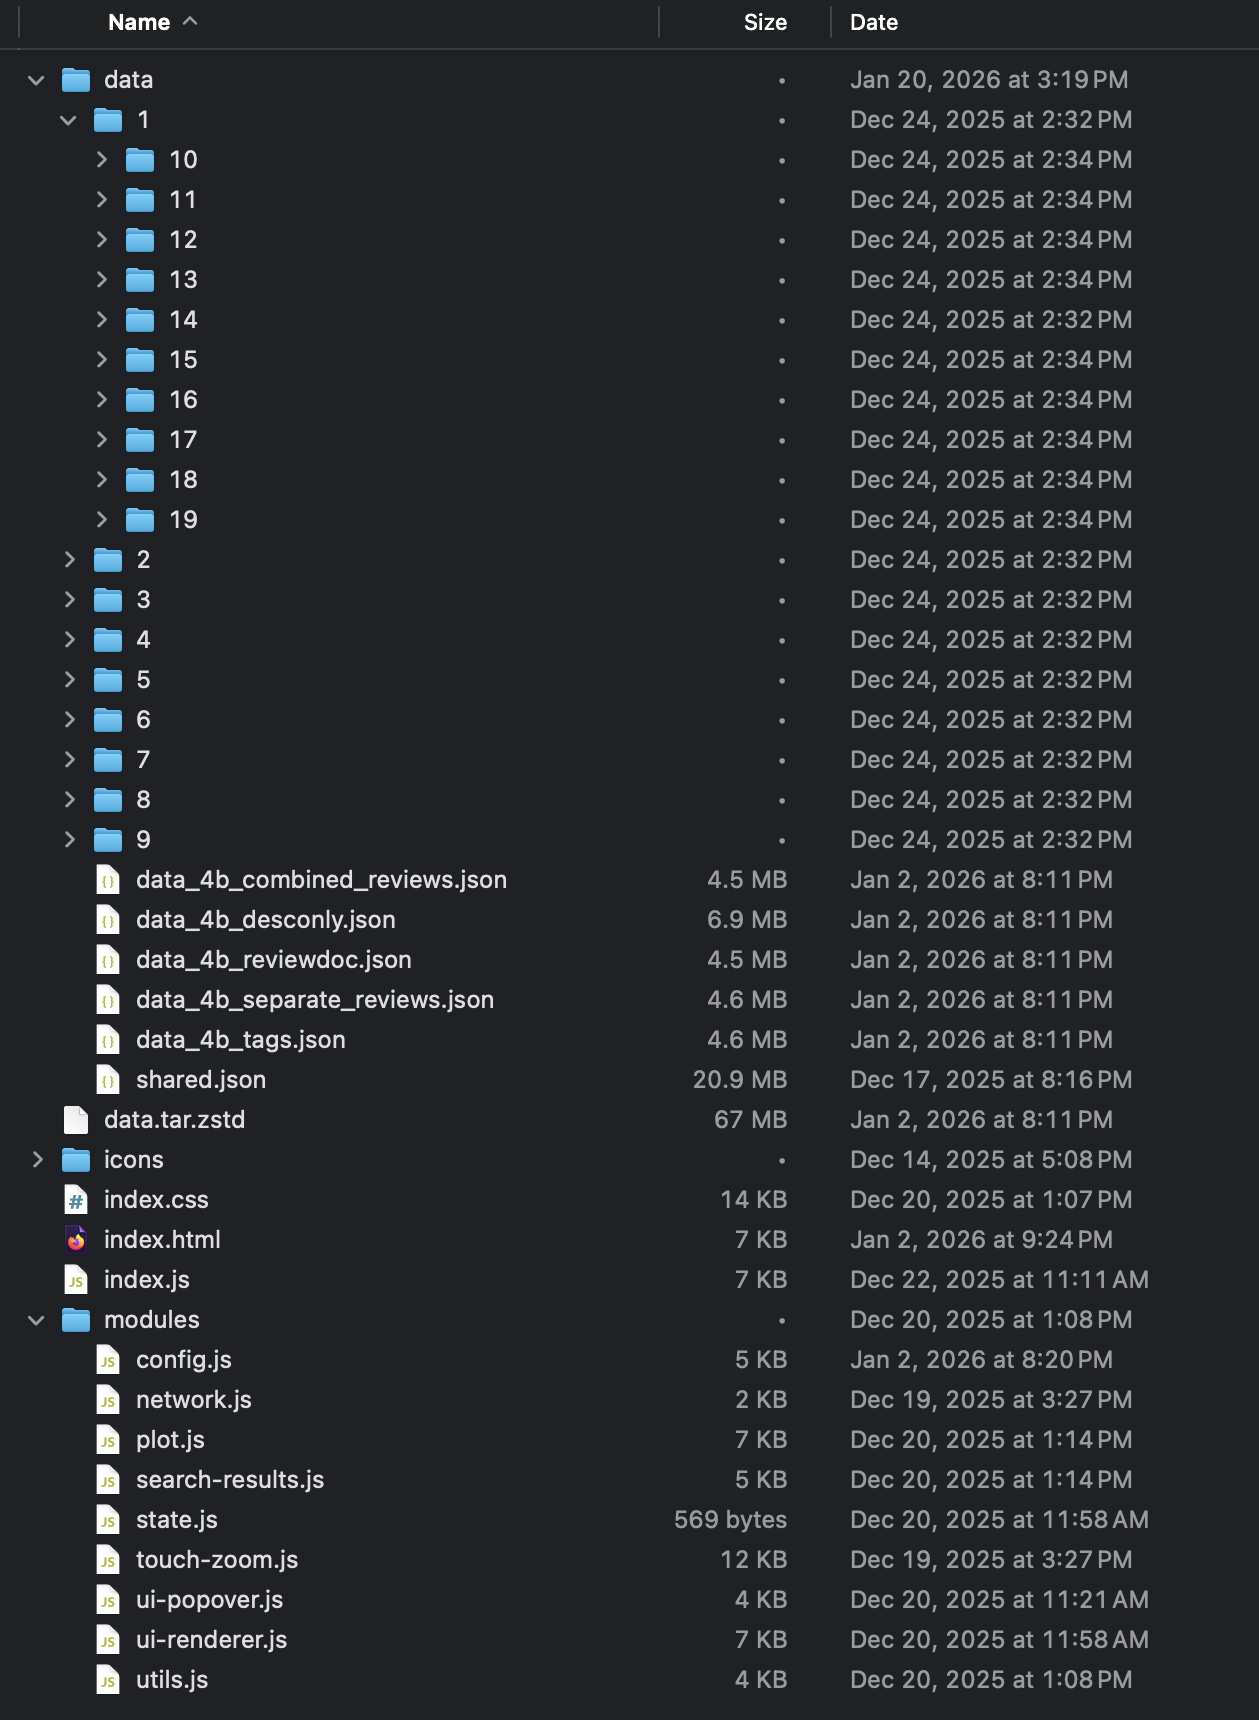
The final on-disk layout for the map.
Lots of consideration was put into figuring out which data always needed to be loaded in order for the map to be useful for the user:
- App ID
- X position
- Y position
- Name (for hover-over tooltip)
- Review count (for point size)
- Review summary (for point color)
And useful data which could be loaded later on, once the user has clicked on the game itself. I decided it should be limited to data a prospective buyer of the game would want to know or see, like:
- Supported platforms
- Tags
- Release date
- Screenshot URLs
Price was originally considered, but Steam’s API seems to return prices inconsistently. My game data randomly has game prices shown in foreign currencies like Euros and Rubles. So for that reason, price data had to be removed from the final project.
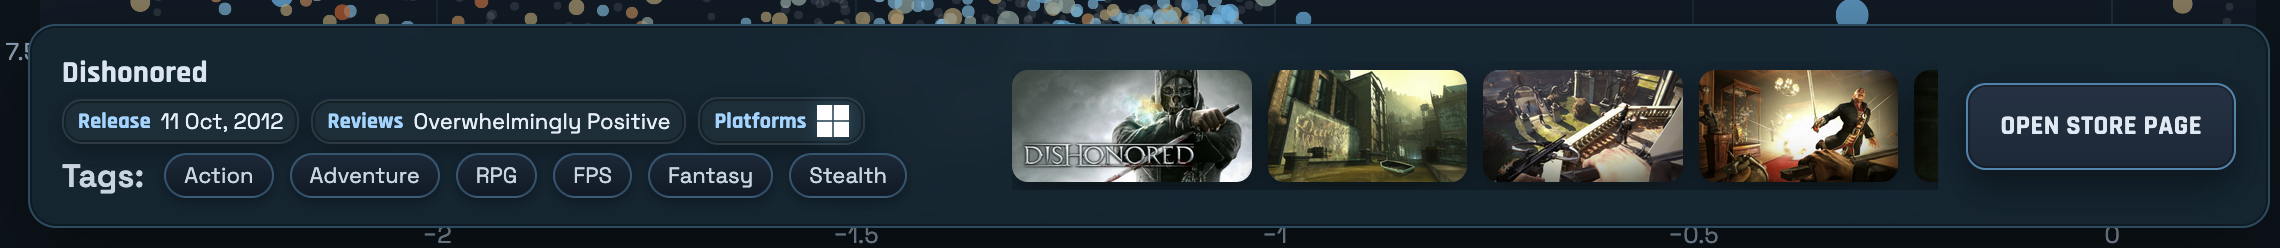
Non-essential information for a game is shown on the bottom bar.
Once the split was made between essential and non-essential data, I created separate JSON files per appid which held the non-essential information. This brought the “required” JSON size down to about 20 MB. That’s not amazing, but with http compression the end-user download size is about 5 MB, which I’m fine living with.
Since there’s over 200,000 games on Steam, to make my life easier when browsing this directory remotely, the individual json files are stored in subdirectories split by the first two digits of the app id.
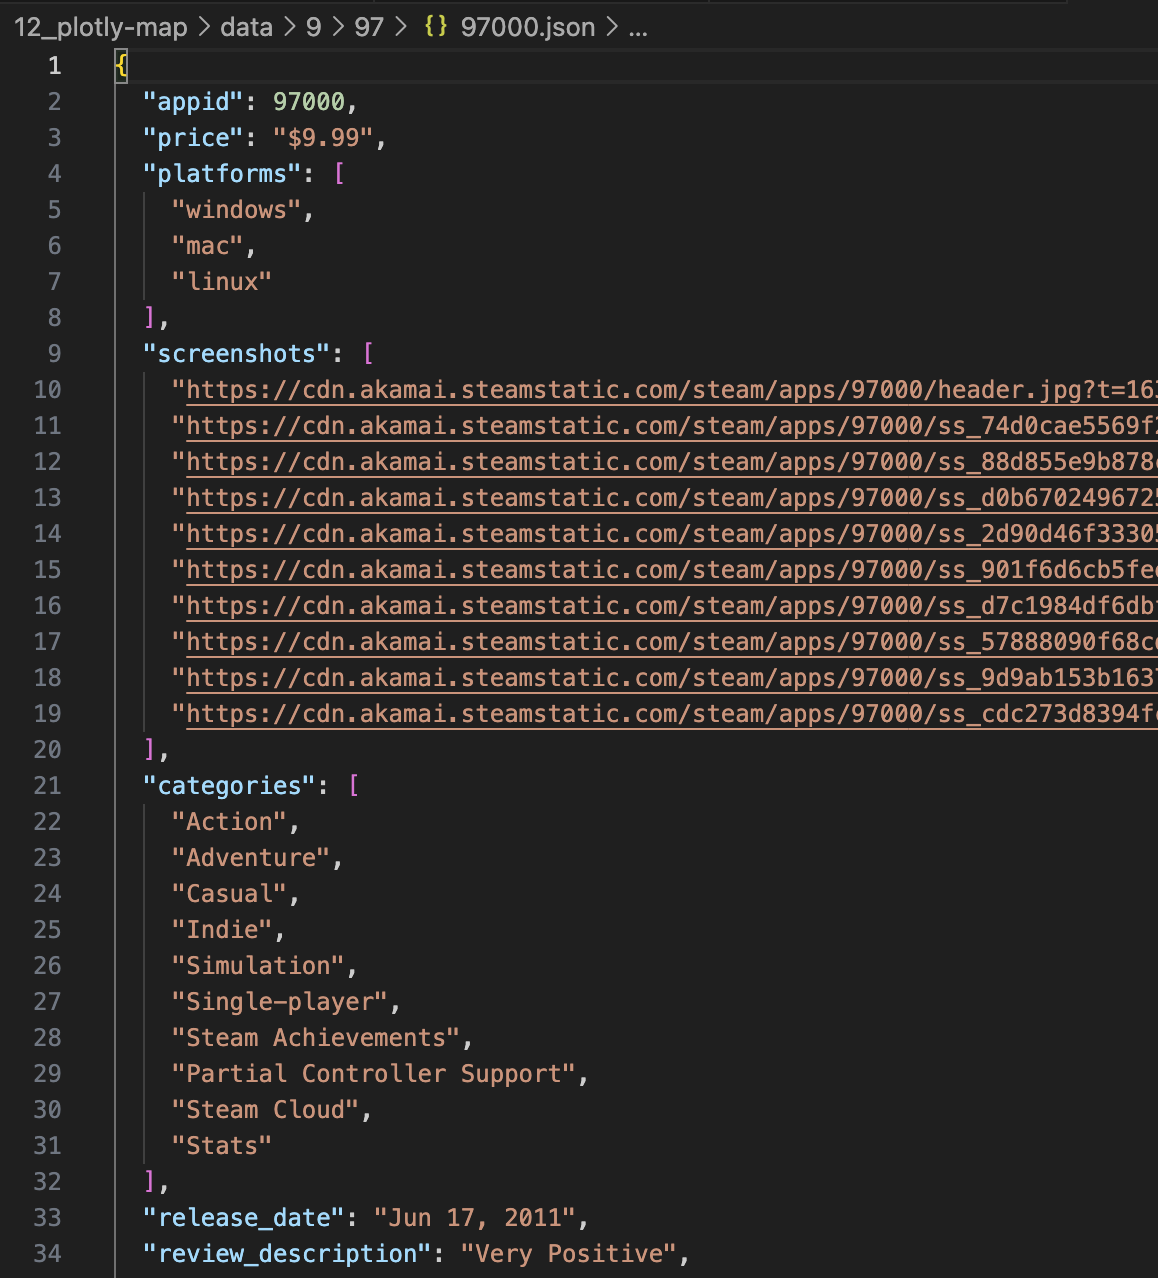
An example of a random game’s data.
Transferring these JSON files between my development computer and server was very time-consuming though, as creating tons of small files over the internet is very inefficient. So to speed data transfers along, I started using a zstd compressed tar of the data directory.
This helped data transfer massively. Decompressed to disk, the complete data directory takes up 967 MB, almost 1 GB. However, once compressed with zstd, it takes just 67 MB. So not only does the file creation happen orders of magnitude more quickly (because decompression happens locally), but the file transfer takes 1/10th the time.
Finally, we’re ready to make the HTML and Javascript. Creation and refinement of the page and JS code was done intermittently over the course of a few weeks with the help of Codex.
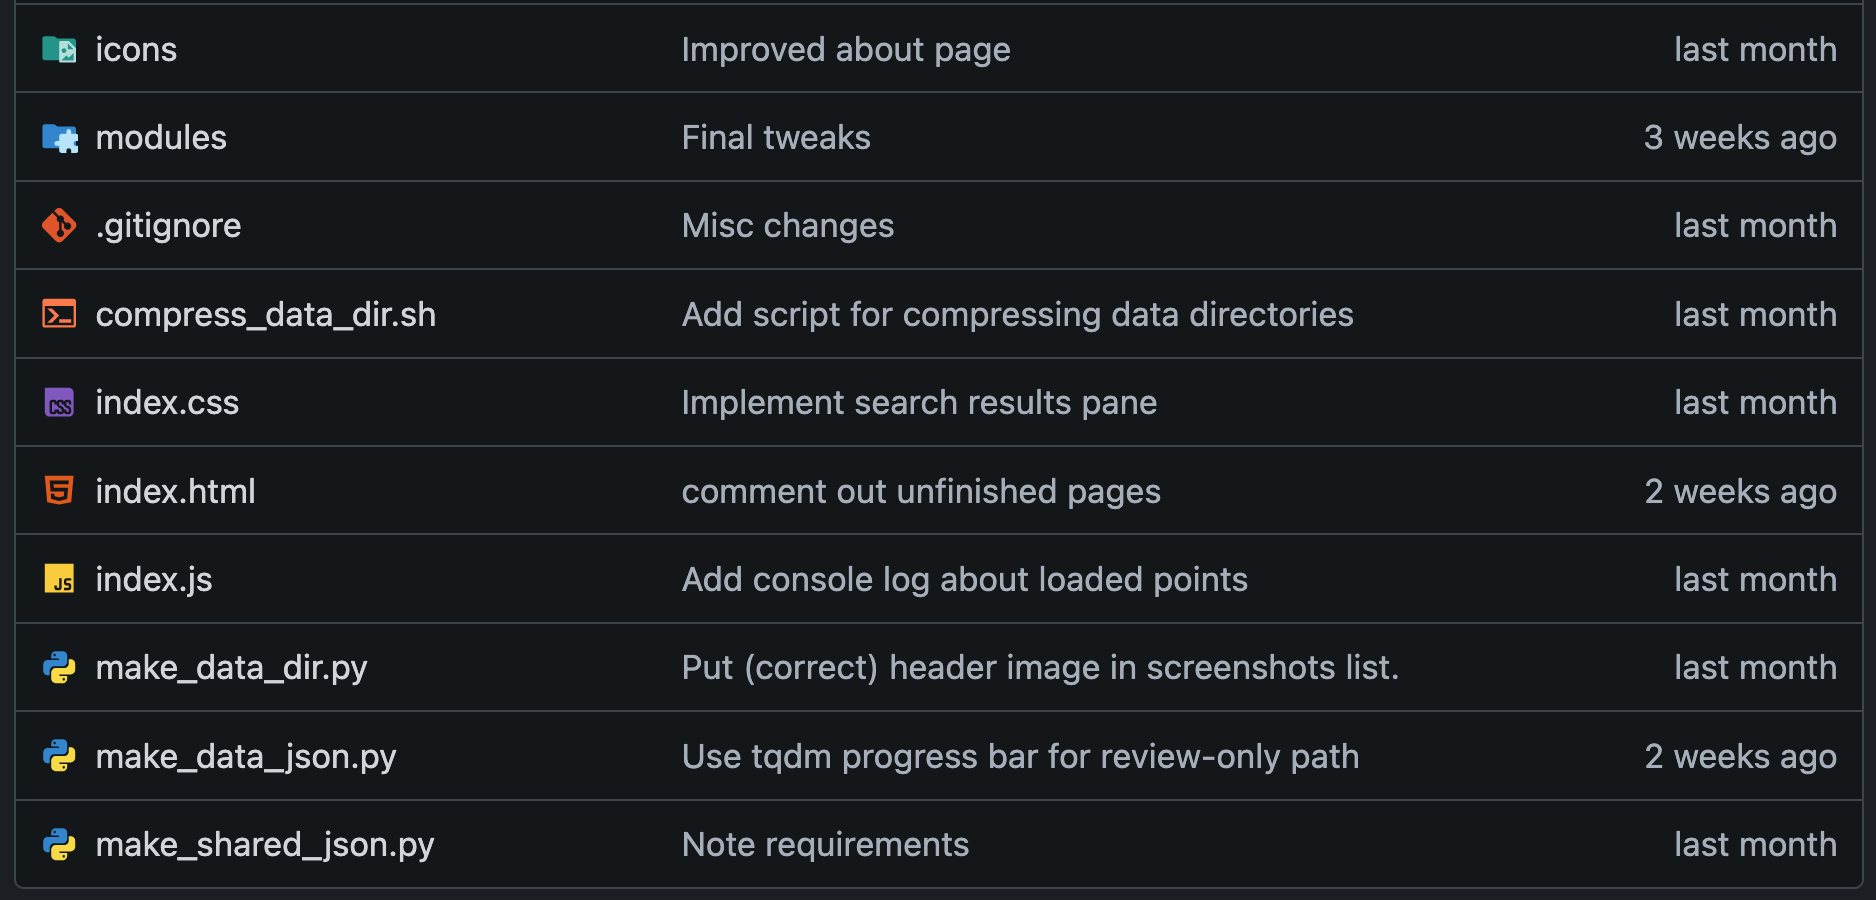
How the repository is laid out.
I could write a ton about vibe coding with Codex, but I feel like there’s enough of that on the internet already, so I’ll keep it brief here. Suffice to say, it did need a fair bit of direction on my part to complete the final project.
Initially the project started as a single HTML file with CSS and JS baked in. However, that quickly starts to overwhelm models, so eventually it needed to be directed to break things up into individual files.
This helped improve the performance of Codex, as previously it would spend a lot of time trying and failing to manipulate specific lines in a huge HTML file. I think Codex benefits a lot from being explicitly told to consider the project structure before beginning new projects. So it’s my mistake I didn’t do that when starting out here.
Other than that, the vibe coding process wasn’t so difficult. I would ask it to implement something, it would come back with an implementation, I would review it, and then tell it what was obviously wrong about it (since it can’t ‘see’ and run the page for itself).
The Future
An old version of the map, early in the data fetching process.
I intend on continuing my tradition of updating my Steam game dataset yearly and likely updating this map when I do so.
The old steam search is probably not going to get updated anymore, though. Or at least, at the moment I don’t intend to update the API’s dataset beyond 2024. The server running the API will likely remain available for the foreseeable future, but will be shut off one day. As all servers are.
I’m hoping I structured this project in a way that makes it very easy to update. Very minimal JS updates will need to be done in order to deploy an updated dataset, so hopefully I can keep that updated indefinitely as well.
As for future iterations on this idea, as mentioned on the previous iteration I still would like to do an itch.io version of this same project.
I believe I did attempt to do the previous iteration (search engine) for Itch, but their store API’s are not nearly as open as Steam’s are. So it was difficult to programmatically query for game information. Perhaps that has changed since last time I tried.
Other than that, I’m not sure! If you have thoughts or suggestions, feel free to let me know!